The Read
CRE spreads remain among the tightest banks have seen in years. That sits uncomfortably next to an FOMC vote that was 8-4, official FDIC data showing bank credit metrics drifted higher, and a Fannie Mae DUS origination surge that came through loan counts, not visible term relaxation.
The contradiction is not that risk disappeared. It is that risk is not repricing CRE uniformly. Agency multifamily activity improved through throughput. Bank credit drift in official data is a backdrop, not a CRE loan-level story. All-CMBS delinquency fell in February while hotel CMBS ticked up and office remained the stress outlier. Five data points, five different market mechanisms.
The rate did not change at the April meeting. But the path got more complicated: an 8-4 vote and a Treasury move after the decision are the kinds of signals that matter when refinancing and exit assumptions depend on a clean easing trajectory.
Why it matters: The simple read, bank risk is up so CRE pricing should be wider, does not match the current data. Narrower, borrower- and collateral-specific analysis is the check.
Chart of the Week: Banks still set the CRE credit denominator
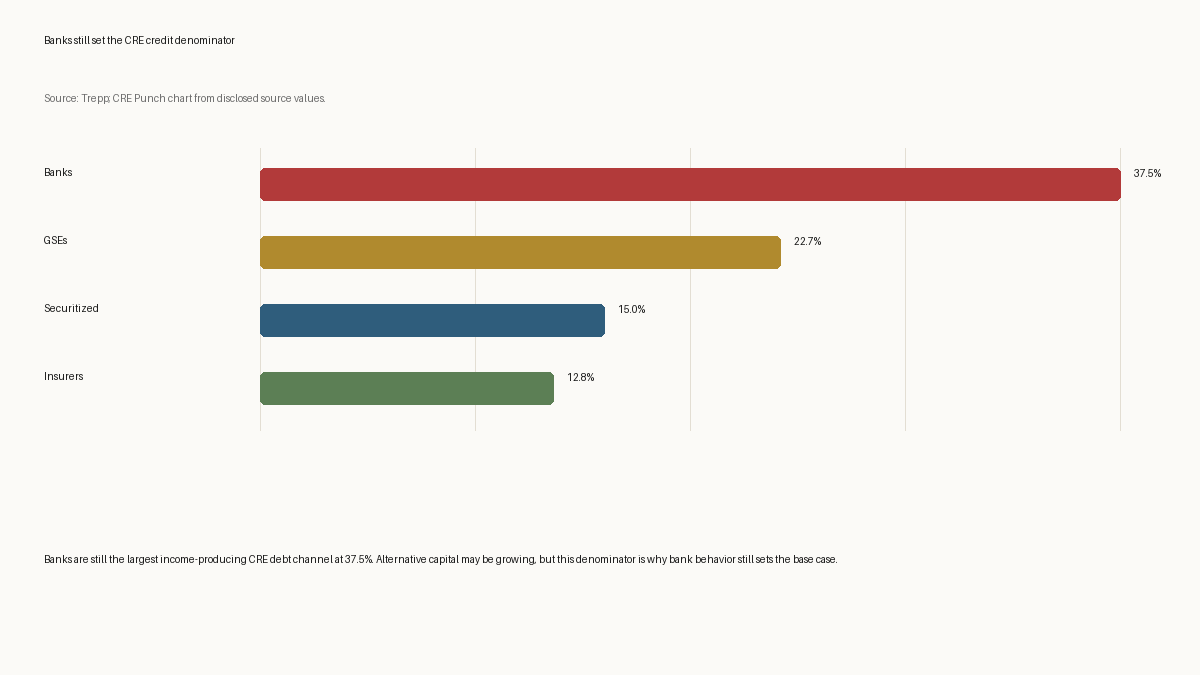
Banks are still the largest income-producing CRE debt channel at 37.5%. Alternative capital may be growing, but this denominator is why bank behavior still sets the base case.
| Lender / channel | Share of income-producing CRE debt |
|---|---|
| Banks | 37.5% |
| GSEs | 22.7% |
| Securitized | 15.0% |
| Insurers | 12.8% |
Source: Trepp; CRE Punch chart from disclosed source values.
Lead Signal
Tight Despite the Risk
Trepp's Q1 2026 regional-bank earnings coverage reports CRE spreads remain among the tightest banks have seen in years against a backdrop of visible geopolitical and private-credit risk factors.
The simple model says risk-up means spreads-wider. That is not what the data show. Risk appears to be filtering through borrower, collateral, and lender selection rather than repricing uniformly across CRE. The assumption that bank-level risk reads directly into CRE pricing needs a narrower check.
Market consequence: Underwriting models that build in broad spread expansion may be ahead of what lenders are actually doing. The CRE spread posture is still tight; the exact spread level is not disclosed in the source.
Watch: Bank Q2 2026 earnings commentary on CRE spread behavior, reserves, and exposure concentration.
Sources: Trepp, "Super Regional Bank Earnings Q1 2026," https://www.trepp.com/trepptalk/super-regional-bank-earnings-q1-2026.
Four More Signals
The Hold Was Priced. The Vote Was the Signal.
The April 2026 FOMC held the federal funds rate at 3.50% to 3.75%. The vote was 8-4, the largest dissent count since 1992, according to Trepp. The 10-year Treasury rose several basis points after the decision.
A priced hold with four dissents and a Treasury reaction is not a non-event for CRE capital costs. The rate stayed flat. The rate path got less legible. Refinancing and exit assumptions built on a clean easing trajectory now face a harder prior.
Market consequence: This is a rate-path diligence question, not a reaction to the hold itself. The dissent count is the signal; the rate level is not news.
Watch: Treasury yields and Fed language on inflation, dissent, and easing bias over the next two meetings.
Sources: Trepp, "FOMC Holds Steady As Markets Look Ahead To Warsh Fed," https://www.trepp.com/trepptalk/fomc-holds-steady-as-markets-look-ahead-to-warsh-fed.
Agency Volume Rose. The Credit Box Did Not Obviously Loosen.
Trepp reports Fannie Mae DUS (Delegated Underwriting and Servicing) origination activity rose sharply in Q4 2025. The increase came through higher loan counts. Average loan balances, underwriting metrics, and structural features stayed largely unchanged. The source notes this was three of the last four quarters, and four of the prior five, with both quarterly and annual issuance increases, the first such run after nine straight quarters without it.
More loans at roughly the same terms is liquidity, not easing. The agency channel moved more product, but there is no evidence the credit box opened or that costs dropped for multifamily borrowers broadly.
Market consequence: Higher agency volume complicates the assumption that better liquidity means easier credit. The distinction between execution capacity and term relaxation matters for multifamily borrowers making financing and timing decisions.
Watch: Whether DUS loan counts keep rising while underwriting metrics and structural features remain steady in the next quarterly DUS report.
Sources: Trepp, "Fannie Mae DUS Activity Rises Sharply In Q4 2025," https://www.trepp.com/trepptalk/fannie-mae-dus-activity-rises-sharply-in-q4-2025.
The Official Credit Drift Is Quiet. Keep It on the List.
FDIC Quarterly Banking Profile data for Q4 2025 show the industry-level net charge-off rate moved from 0.61% in Q3 to 0.63% in Q4. Past-due and nonaccrual rates moved from 1.49% to 1.56% over the same period.
These are industry-level bank metrics, not CRE-specific loan data. No vulnerable bank is named. No CRE collateral is identified. What the FDIC data adds is a conservative official read: bank credit metrics drifted modestly higher in the same quarter that shows CRE spreads holding tight. The two moves point in different directions, and that combination is worth tracking.
Market consequence: This is a watch item for bank-lending behavior, not proof of CRE loan deterioration. The modest drift sets up a question for Q1 2026 FDIC data.
Watch: Q1 2026 FDIC QBP metrics, bank CRE concentration disclosures, and bank earnings commentary on charge-off trends together.
Sources: FDIC, "Quarterly Banking Profile Q4 2025," https://www.fdic.gov/quarterly-banking-profile/quarterly-banking-profile-q4-2025.
CMBS Stress Is Elevated. February Still Moved the Other Way.
CREFC MarketMetrics reported all-CMBS delinquency at 7.47% in January 2026 and 7.14% in February 2026, a month-over-month decline while overall stress remains elevated.
The February direction matters because broadening-CMBS-stress is still the default frame. A decline from 7.47% to 7.14% is not a recovery call. But it is not uniform worsening either. CREFC data show hotel CMBS ticked higher (5.56% to 5.94%) while office, multifamily, and retail all moved down. The stress map is rotating by collateral type.
Market consequence: CMBS assumptions that treat all property types as moving in the same direction are not reading the February data cleanly. The level is still elevated; the direction is mixed.
Watch: March delinquency and special-servicing metrics once normalized, and whether the office CMBS improvement from 12.34% to 11.20% continues.
Sources: CREFC, "CREFC MarketMetrics (3-27-26)," https://www.crefc.org/common/Uploaded%20files/Learn/CREFCFinanceData/2026%20MarketMetrics/CREFC%20MarketMetrics%20(3-27-26).pdf.
What To Watch
- Bank Q2 2026 earnings commentary on CRE spread behavior, reserves, and exposure concentration.
- Treasury yields and FOMC language on dissent, inflation, and easing bias over the next two meetings.
- Whether Fannie Mae DUS loan counts keep rising while underwriting metrics and structural features remain steady.
- Q1 2026 FDIC QBP credit metrics and bank CRE concentration disclosures.
- March CMBS delinquency by property type, and whether the office improvement from 12.34% to 11.20% holds.
Sources
- Trepp, "Super Regional Bank Earnings Q1 2026" (2026-05-03) - https://www.trepp.com/trepptalk/super-regional-bank-earnings-q1-2026
- Trepp, "FOMC Holds Steady As Markets Look Ahead To Warsh Fed" (2026-04-29) - https://www.trepp.com/trepptalk/fomc-holds-steady-as-markets-look-ahead-to-warsh-fed
- Trepp, "Fannie Mae DUS Activity Rises Sharply In Q4 2025" (2026-04-28) - https://www.trepp.com/trepptalk/fannie-mae-dus-activity-rises-sharply-in-q4-2025
- Trepp, "Inside the CRE Debt Universe Q4 2025" - https://www.trepp.com/trepptalk/inside-the-cre-debt-universe-q4-2025
- FDIC, "Quarterly Banking Profile Q4 2025" (2026-04-27) - https://www.fdic.gov/quarterly-banking-profile/quarterly-banking-profile-q4-2025
- CREFC, "CREFC MarketMetrics (3-27-26)" (captured 2026-05-01) - https://www.crefc.org/common/Uploaded%20files/Learn/CREFCFinanceData/2026%20MarketMetrics/CREFC%20MarketMetrics%20(3-27-26).pdf
Method Note
This issue is assembled from source-gated public reports, official regulatory data, and named data-provider materials. Stories are selected as a portfolio of distinct market signals; each story is chosen to change a specific prior belief about CRE pricing, credit, or capital behavior rather than to serve as an investment recommendation. Sources include Trepp (data provider), FDIC (U.S. banking regulator), and CREFC (trade association data publisher). This is a capital-markets signal brief, not investment advice.